Preview area
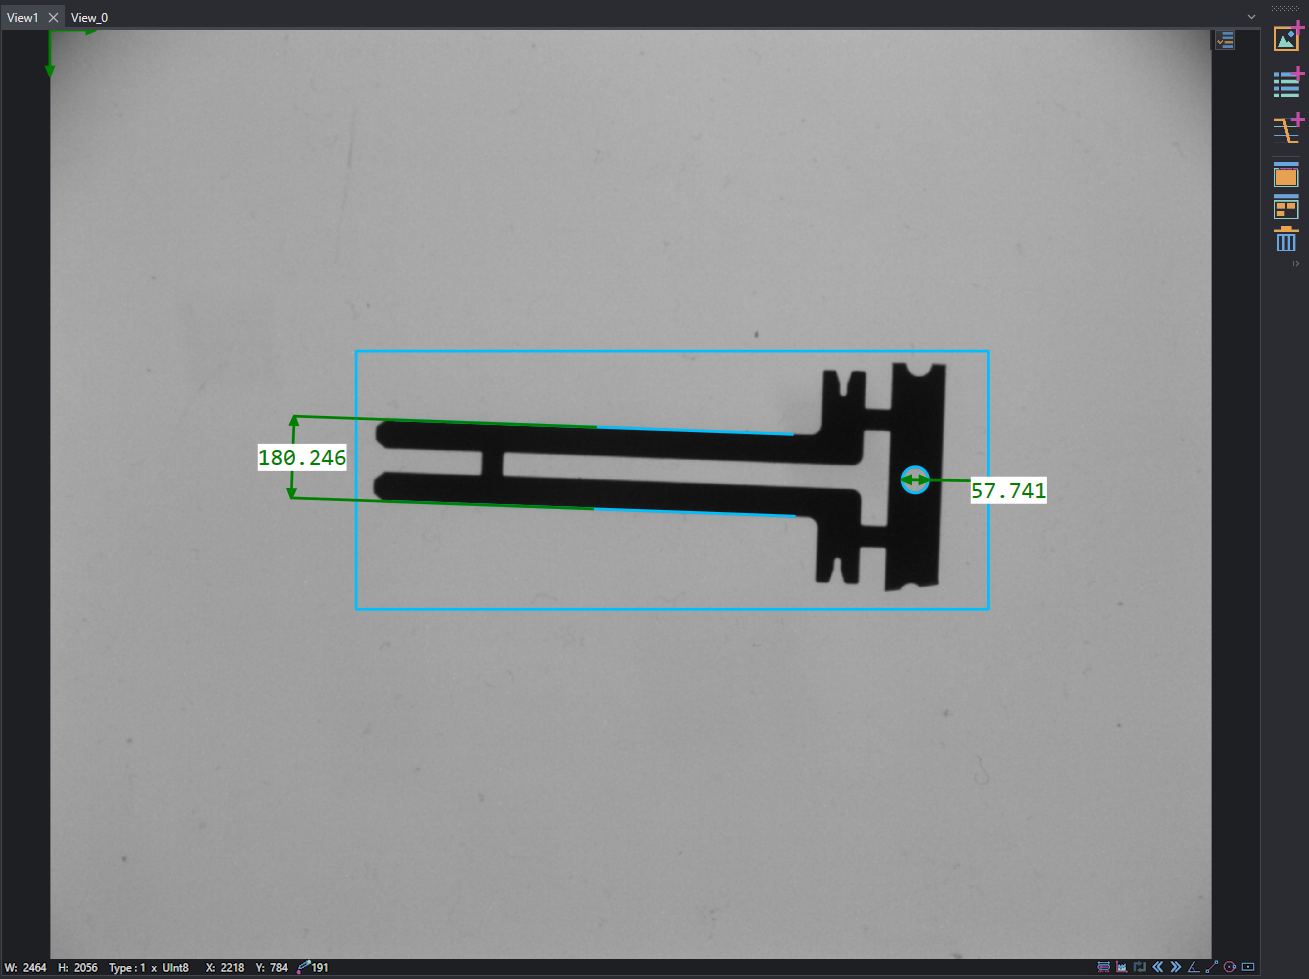
Images, Edges and Geometry objects can be displayed by easily dragging and dropping them on a View into the Visualizer panel. In general, all the properties with the image icon next to their names can be displayed (see Property Panel to get an example about this).
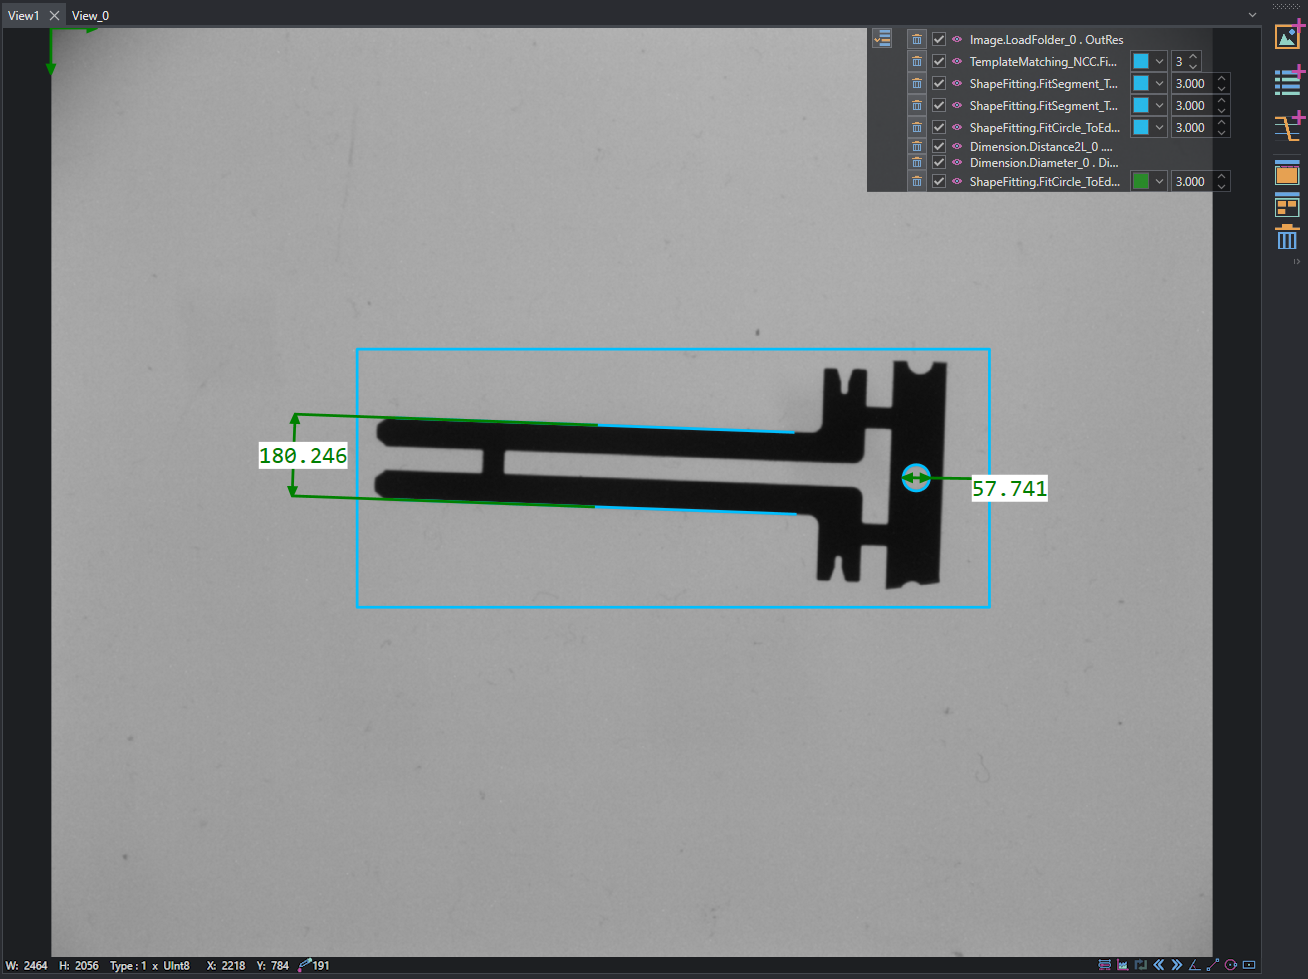
Each item in the view will appear on the list of the top-right of the view (which can be minimized by clicking on its icon).
All item in the list can be:
- Erased from view (basket button).
- Hided/Showed (checkbox button).
- Changed color and the thickness of their representation (only available for shapes objects, such as lines, points, arcs...)
On each view, only one Image object can be visualized at once, and the properties must all be of the same type. If you need to display properties of different types, you can add a new view.
At the bottom left of each view you can find the image size, image type, the position of the mouse pointer within the image itself and the pixel value of the point indicated by the mouse pointer (based on pixel's format and image's channels the values are displayed accordingly).
Note
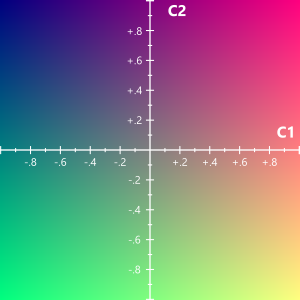
When a 2-channels image visualization is requested it is automatically visualized as a 4-channels image.
An alert icon  appears near the pixel value and a legend for the used colors can be found in the image below and in the alert icon tooltip too.
Note
When a 1-channels / 3-channels / 4-channels image visualization is requested an alert icon appears near to the pixel value .
This warns the user because the preview for Float images is not representative of the real contrast due to gamma curve mismatch and images could appear washed out and/or brighter. If an accurate reading is needed refer to pixel values.
In the top-right corner of the Visualizer a toolbar can be found. By using this control you can:
 — Add a new View for image and 2D data types.
 — Add a new Table view to display text format data.
 — Add a new Graph view to display profiles and numerical data.
 — Switch to single tab view (one view at a time).
 — Switch to grid view (multiple views).
 — Delete all views.
A number of shortcuts are available to simplify the management of views:
- Tab view — Ctrl+Shift+T
- Grid view — Ctrl+Shift+G
- Next view — Ctrl+Shift+Right
- Previous view — Ctrl+Shift+Left
- Go to first, second, etc. view — Ctrl+Shift+1..9
For shortcuts to work you must have focus on the preview.
Image Toolkit

At the bottom right of each view there is the image toolkit, by using it the user can do some operations on the visualized image.
Warning
All operations are executed only on VISUALIZED image, the original data remains unchanged.
Warning
Not all operations can be activated simultaneously.
This control is designed to:
- Normalize image
- Calculate and visualize a line profile
- Swap image channels (only for 3-channels images)
- Bit-shift left/right
- Draw and measure angles
- Draw and measure segments
- Draw and measure circles
- Draw and measure rectangles
Tip
All operations can be deactivated by pressing ESC.
Tip
If during a draw operation Left SHIFT is pressed the point is automatically "snapped" at 45 degrees step.
Normalization
When normalization is active an editor appears in the bottom-right corner of the viewer.
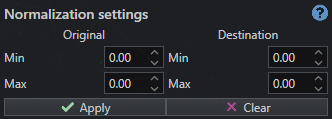
Normalization is used to modify the image so that its minimum (original minimum) becomes destination minimum and the maximum (original maximum) becomes destination maximum. Apply button is used to apply normalization to the currently visualized image and clear deactivates this functionality and the visualized image returns to the default value.
Profiler
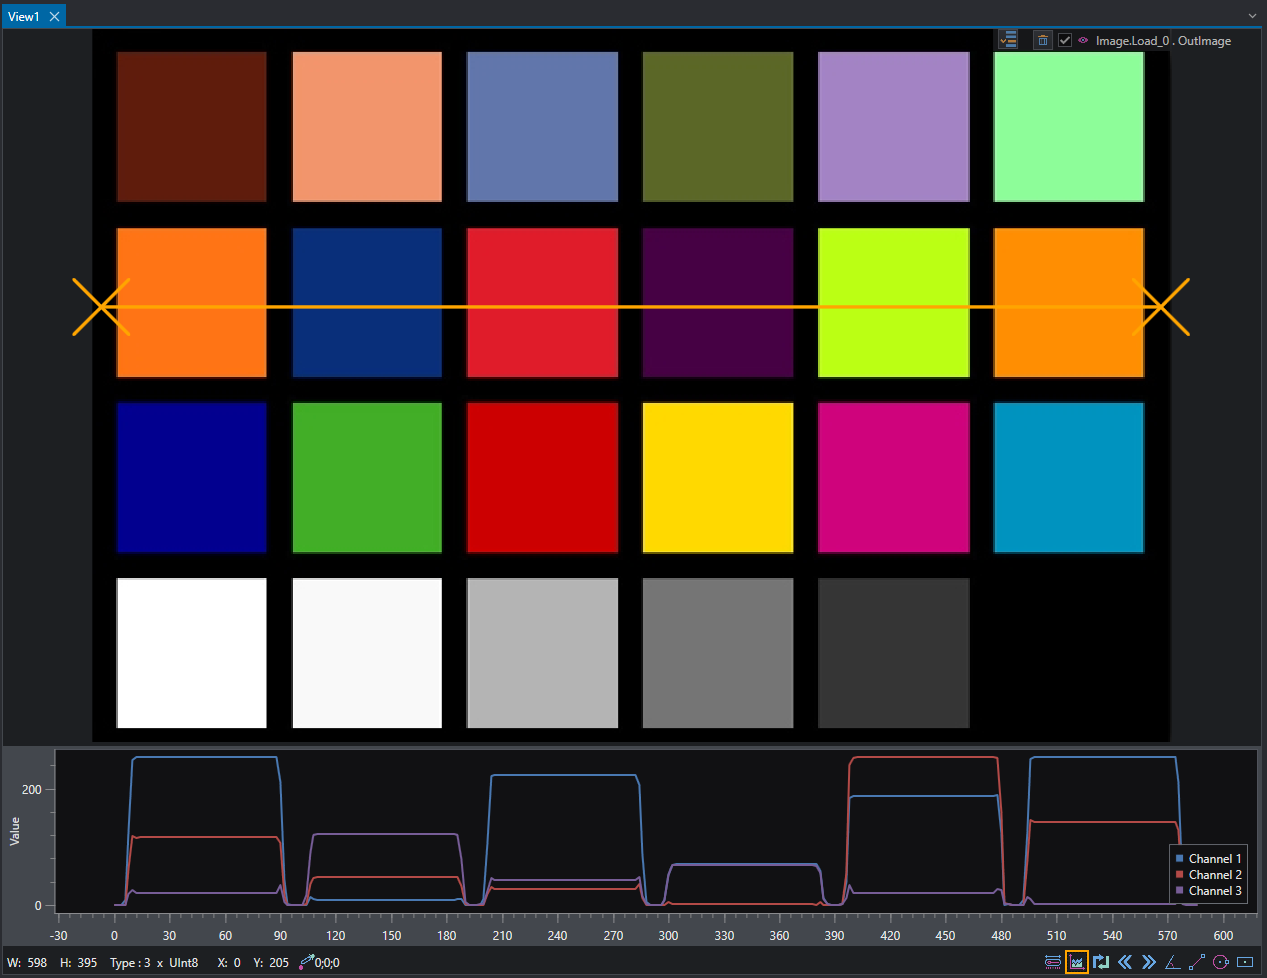
When profiler is activated user should draw a segment over the image, once the second point is drawn a chart will show the color profile for each pixel of that segment. Every channel is displayed as a separate line in the chart.
Swap Channels

Swap channels functionality is used to reverse the order of channels in a 3-channels image. This is activated to correct RGB-BGR images visualization.
Warning
Swap channels can be used in 3-channels images only.
Bit-shift

Bit-shift operation multiplies or divides all image's pixels by 2 to the power of a user selected value. To avoid complexity two buttons are available:
- Left bit-shift: multiplies all image's pixel and this results in a brighter image
- Right bit-shift: divides all image's pixel and this results in a darker image
Typically this is used when you are working with an image with a pixel format greater than UInt8 since drawing that image without a bit-shift operation results in a very dark visualization. When this functionality is activated an editor appears in the bottom right of the viewer.
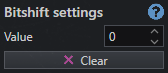
Value field is used to change the power of 2 that multiplies / divides image's pixels. Clear button deactivates this functionality and the visualized image returns to the default value.
Angle Ruler
Angle ruler is a tool to manually draw and measure an angle over the image.
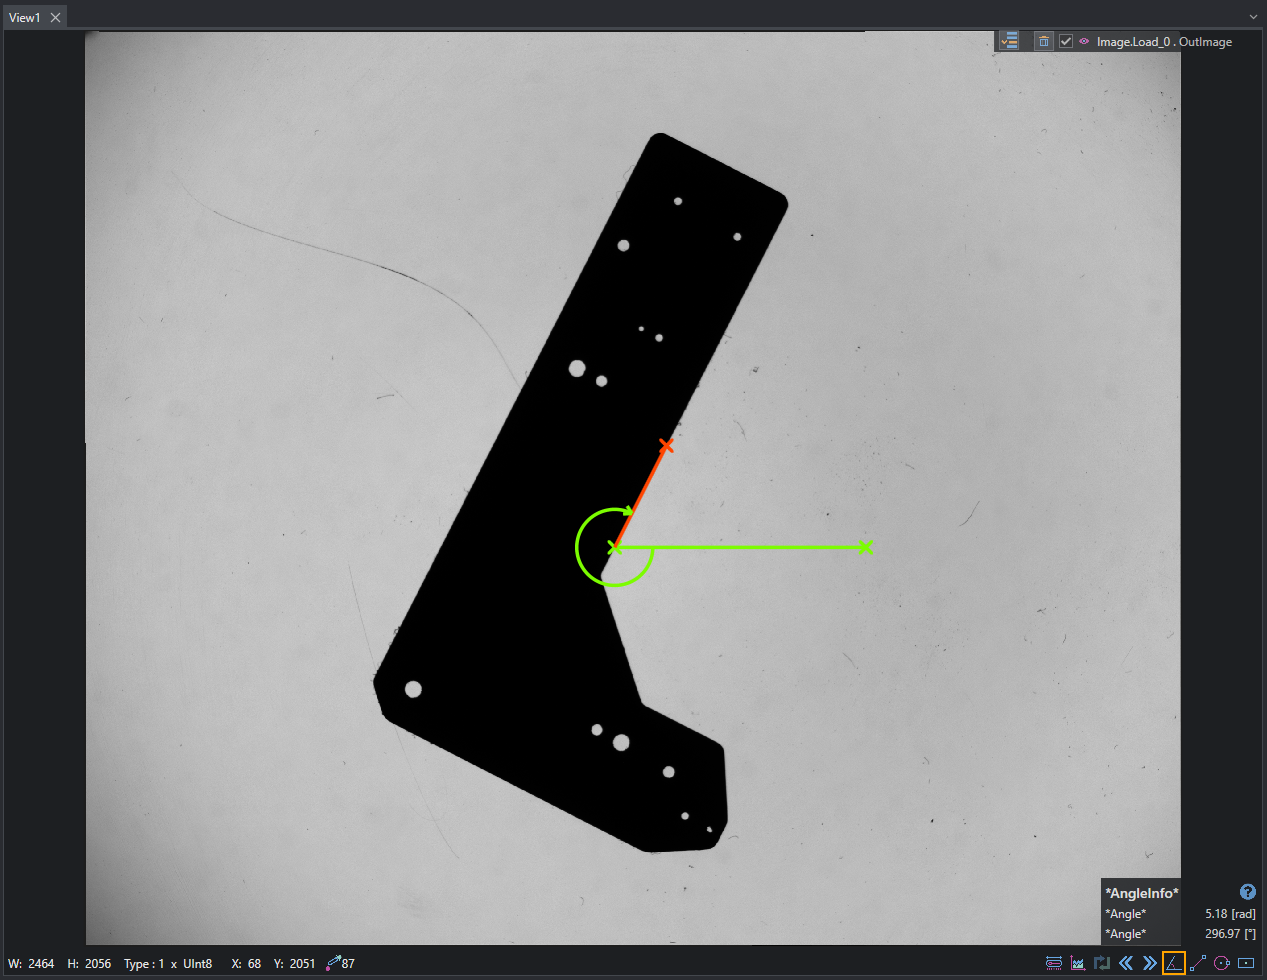
When the angle ruler is activated it is possible to start drawing over the image, to create this angle tool 3 points are necessary. By clicking on the image you can set them, first two points sets the reference line (displayed in green) the second and the third point sets the end line (displayed in dark orange). The angle between this two lines is measured in positive direction only. Once the third point is set all remains fixed even if the mouse is moved around the image and the resulting angle can be found in the bottom right corner of the viewer. To start a new angle creation simply click on the image and the previous one will be cleared and the first point set.
Warning
Angles are measured in positive direction only.
Segment Ruler
Segment ruler is a tool to manually draw and measure a segment over the image.
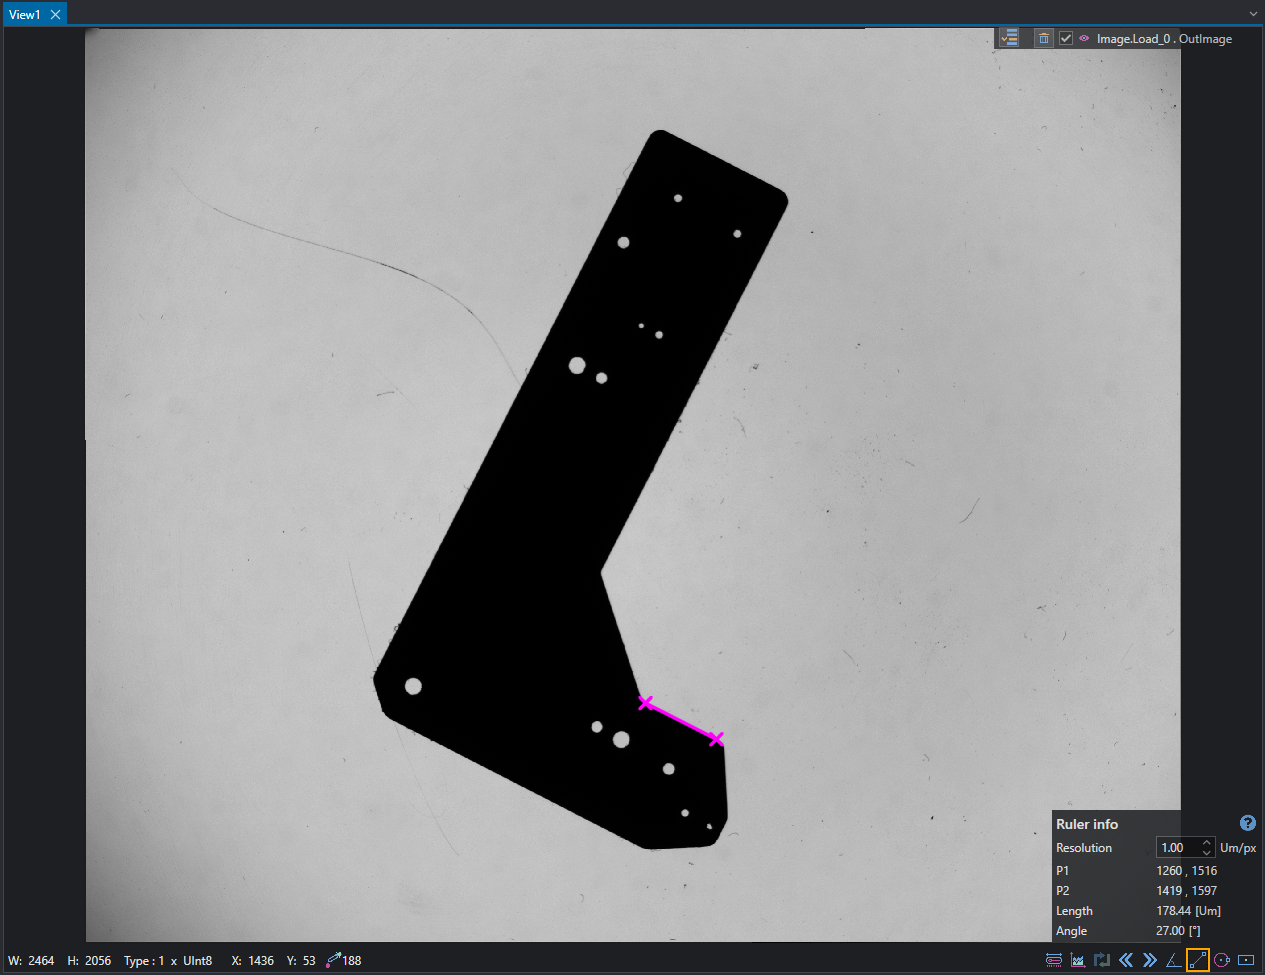
When the segment ruler is activated it is possible to start drawing over the image, to create this tool 2 points are necessary. By clicking on the image the creation starts it ends when the left mouse button is released. Once the creation is done all the information about the segment are displayed in the bottom right corner of the image. Here you can find:
- First segment's point coordinates in pixels
- Second segment's point coordinates in pixels
- Segment's length
- Segment's angle
By changing the Resolution field the segment's length is recalculated and is displayed in user's measure unit.
Circular Ruler
Circular ruler is a tool to manually draw and measure a circle over the image.
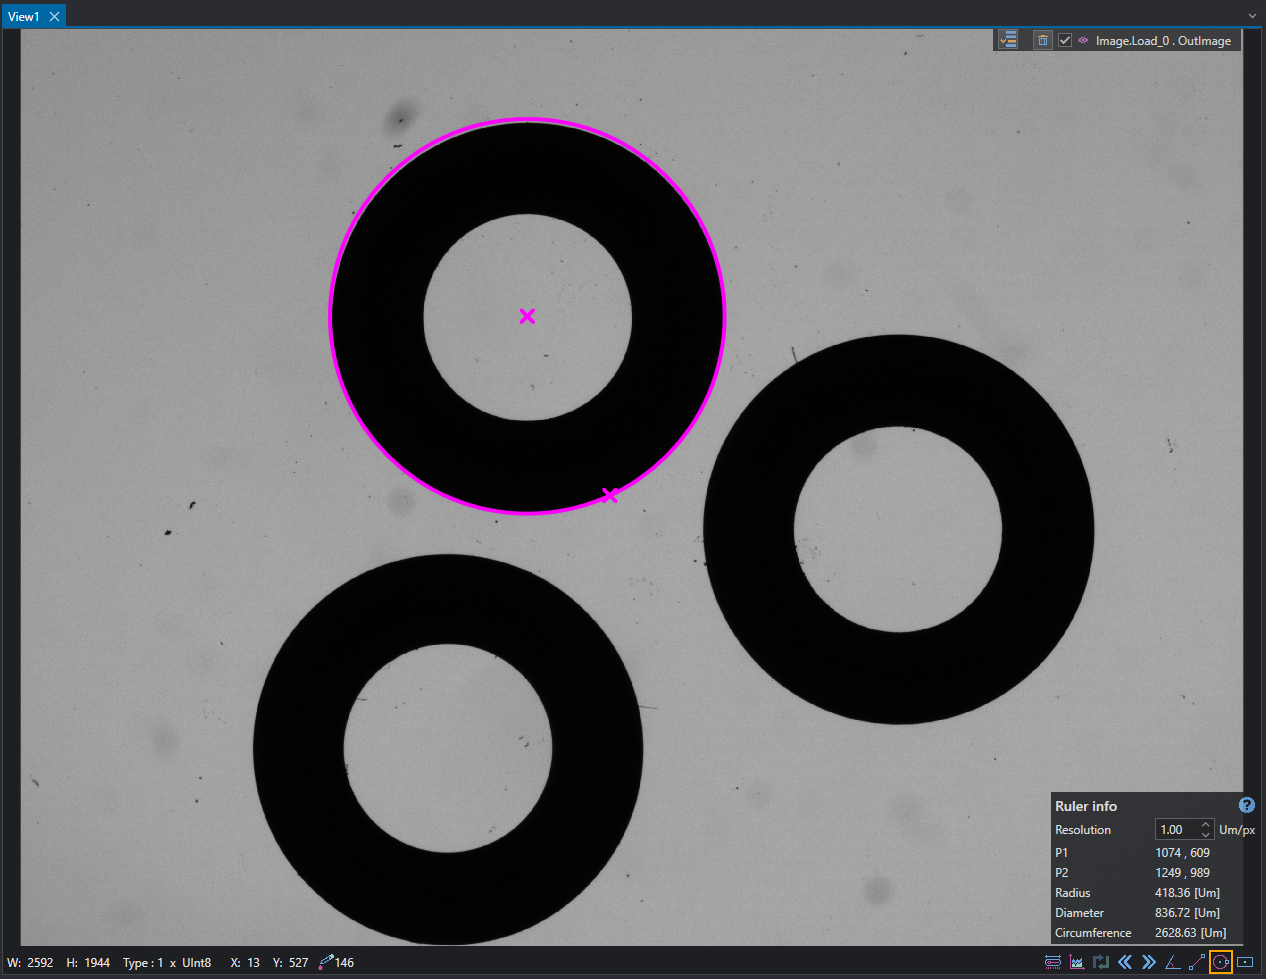
When the circular ruler is activated it is possible to start drawing over the image, to create this tool 2 points are necessary. By clicking on the image the creation starts it ends when the left mouse button is released. Once the creation is done all the information about the circle are displayed in the bottom right corner of the image. Here you can find:
- Circle's center point coordinates in pixels
- Circle's second point coordinates in pixels
- Circle's radius
- Circle's diameter
- Circle's circumference
By changing the Resolution field radius, diameter and circumference are recalculated and displayed in users's measure unit.
Rectangular Ruler
Rectangular ruler is a tool to manually draw and measure a rectangle over the image.
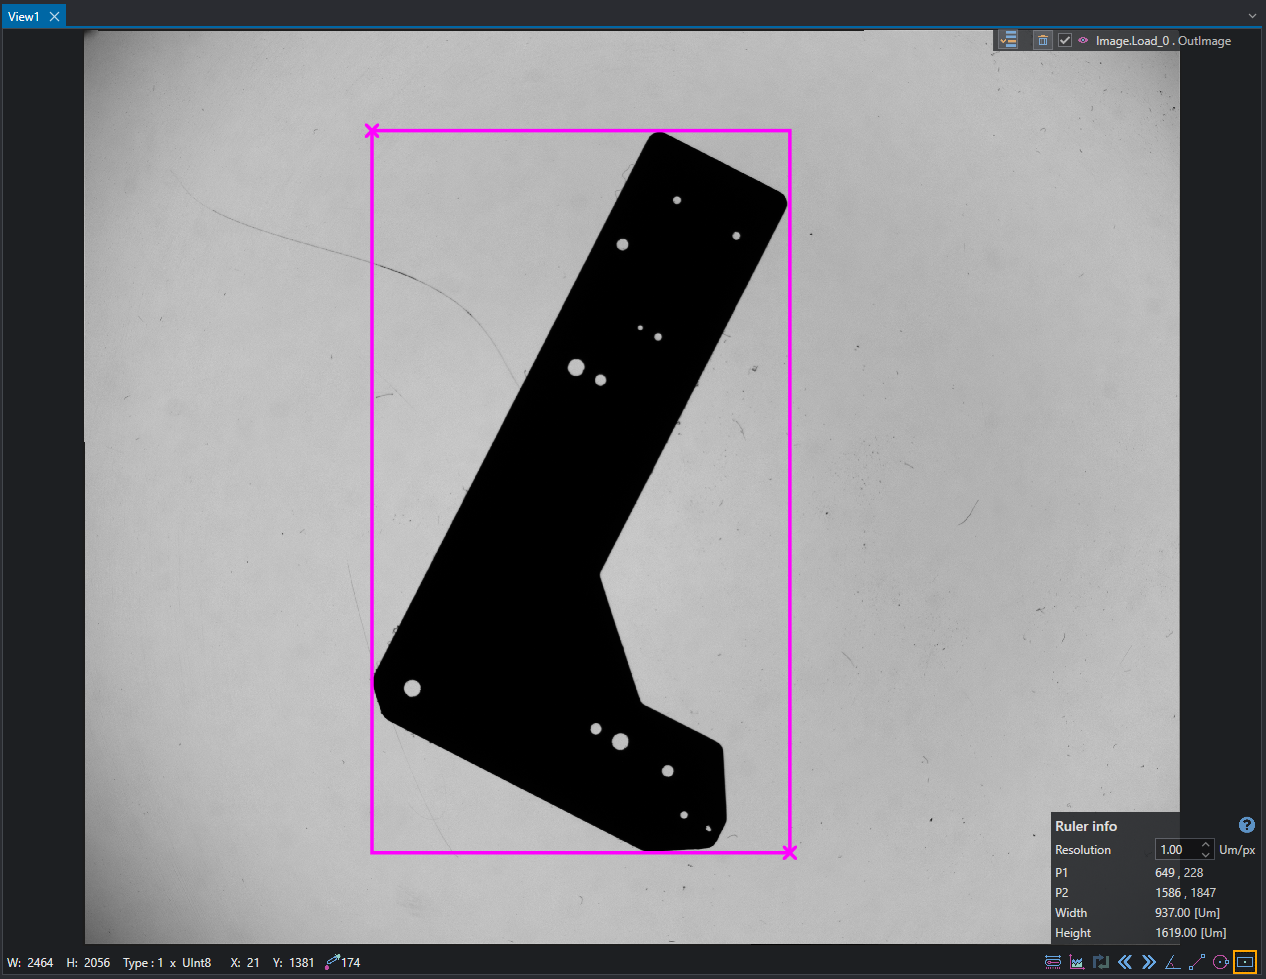
When the rectangular ruler is activated it is possible to start drawing over the image, to create this tool 2 points are necessary. By clicking on the image the creation starts it ends when the left mouse button is released. Once the creation is done all the information about the rectangle are displayed in the bottom right corner of the image. Here you can find:
- Rectangle's top left point coordinates in pixels
- Rectangle's bottom right point coordinates in pixels
- Rectangle's width
- Rectangle's height
By changing the Resolution field width and height are recalculated and displayed in users's measure unit.
Evaluate Panel
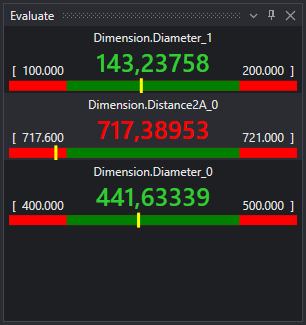
The evaluation panel provides a quick way to understand if an object's properties are within the tolerance parameters you set.
It is shown if at least one tool of the Dimension category is used in the job.
An example of tools that can use this panel are the Dimension tools, but it can be used with every tool or procedure that returns a numeric value. In the panel all the dimensions evaluated are displayed. For each dimension, the panel reports:
- Its name.
- The value of the dimension, which is green in case it respects the given range, or red if it does't.
- The maximum and minimum value of the range.
- A graphical representation of the measure, with an analog indicator of where the result is positioned within the range.