Output Panel
Output
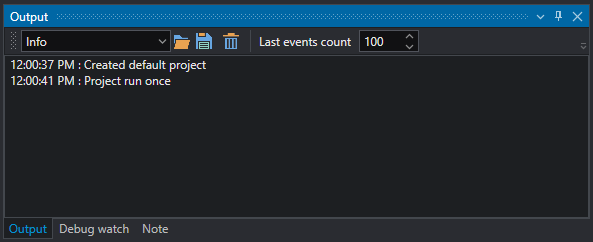
The output panel displays the event log. Events are filtered by selecting:
- Quiet: no events shown.
- Minimal: error only.
- Normal: warning and error.
- Diagnostic: all events.
The last three buttons are used to open the log folder, save the current log, delete it, limit the number of entries in the log to a value that can be selected in the adjacent box.
Note
This control shows a preview of log file(s); if events are deleted, the base log file is still available and keeps the entire history.
Debug Watch
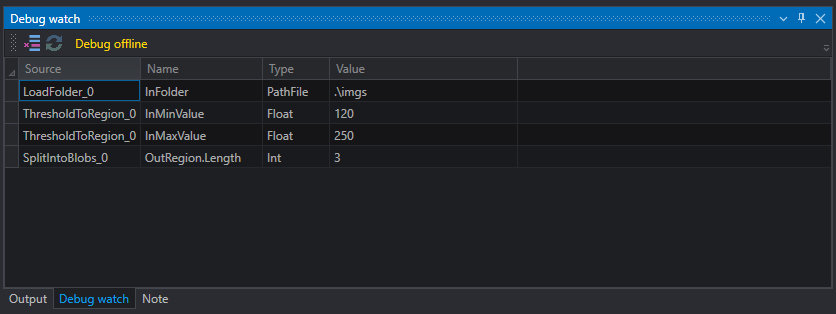
This panel allows you to keep track of the values of the selected properties when the program is running. In order to add a watched property you just need to drag it into the panel.
For each property the panel shows:
- The source of the object that owns the property.
- The property name.
- The object type of the property.
- The current value of the property.
The buttons at the top are used respectively to clear the list and force the values to be updated while debugging, if you hit a breakpoint. On the label on the side there is an indication of the debug status:
- Debug offline: project is stopped;
- Debug online: project is running.
The panel allows also to inspect values of variables created by user; in this case the source field has value GLOBAL to indicates that it comes from global variables.
To add a new item into the panel, simply drag and drop the desired tool property or variable into int
Note
This panel allows to write some plain text notes. On the top toolbar there are some basic cut, copy and paste buttons.
Read this panel on the included examples in order to obtain more information on the use case shown in the project.
Modbus Inspector
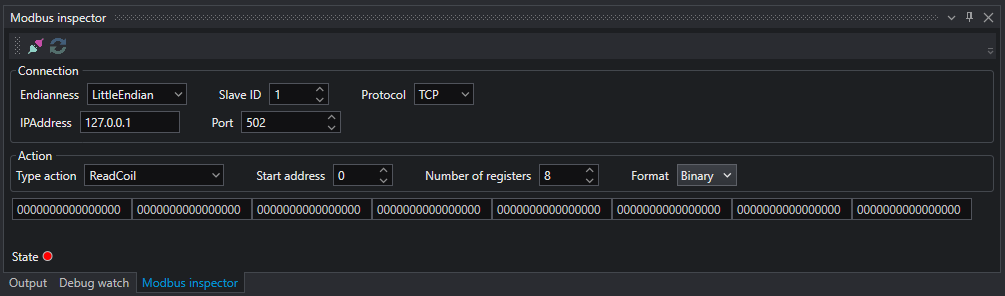
With the Modbus inspector you can connect to a Modbus server to read or write values for testing.
In the top toolbar, there are two buttons:
 — Connect and disconnect the client to the server
 — Refresh values
The Connection section allows to configure the connection settings. In order to connect to the OEVIS® internal Modbus server, compile this section with the same data that has been set in System/Devices during the configuration of the server.
The Action section allows to choose the type of operation, the starting address, the number of registers and the data visualization format.
In the data table below, you can read or enter the values in the selected format. An LED at the bottom will indicate the connection status. Red LED means not connected, green LED means connected.